Investigation of the Impurities Found in
Methamphetamine Synthesized from Pseudoephedrine
by Reduction with Hydriodic Acid and Red Phosphorus

K.L. Windahl, M.J. McTigue, J.R. Pearson, S.J. Pratt, J.E. Rowe, E.M. Sear
Forensic Science International, 76, 97-114 (1995)

HTML by Rhodium

Abstract

The synthesis of methamphetamine from pseudoephedrine via the reduction with hydriodic acid and red phosphorus was studied and the impurities which were generated, along with the methamphetamine, were investigated. Some of the impurities found have been reported previously, while the diastereoisomers of N-methyl-N-(α-methylphenethyl)-amino- 1-phenyl-2-propanone and the cis-cinnamoyl derivative of methamphetamine are reported here for the first time. Further work on the sequence of reactions occurring in this reduction is also reported.

1. Introduction

Methamphetamine 1 is a widely abused and highly addictive stimulant drug. The illicit synthesis of this compound has been achieved most commonly by the reductive amination of phenyl-2-propanone 2, by the Leuckart formamidation of 2 followed by hydrolysis or by the reduction of ephedrine or pseudoephedrine 3 with hydriodic acid and red phosphorus. This latter method is currently the most common encountered in clandestine laboratories in Victoria3. In this investigation, we have studied the structures of the impurities generated along with methamphetamine using this route from pseudoephedrine.

Fig. 1.
Products from the reduction of ephedrine with HI and red phosphorus.

The knowledge of these impurities is important for several reasons: (i) it can reveal information on the synthetic methods used to produce the drug, (ii) it may link samples to a common source dealer or illicit laboratory, (iii) their identification is essential so that they do not interfere with the analytical techniques used for drug analysis and (iv) the toxicity of these impurities may have potential harmful effects on methamphetamine users. Other workers have reported some of these impurities previously as shown in Fig. 1. Cantrell et al.1 and Skinner2 have both reported phenyl-2-propanone 2, cis- and trans-1,2-dimethyl-3-phenylaziridine 4, 1-benzyl-3-methylnaphthalene 5 and 1,3-dimethyl-2-phenylnaphthalene 6. Tanaka et al.3 have recently reported the dimeric structure 7.


2. Experimental

The GC analysis was carried out on a Hewlett Packard 5880A GC equipped with a flame ionization detector. A HP-1 12 m x 0.22 mm I.D. column with a 0.33 µm film thickness was used with He as carrier gas at a pressure of 150 kPa. The injection temperature was held at 250°C and used in the split mode with a split ratio of ~100:1. The detector temperature was 300°C and the following oven temperature program was run: initial temperature 75°C for 1 min, 20°C/min to 300°C, then 300°C for 3 min. Electron impact GC/MS analysis was as reported previously4. Chemical ionisation GC/MS data were obtained on a HP 5890 gas chromatograph interfaced to a HP 5980 mass spectrometer, using methane as the reagent gas.

NMR data for 8 and 9 were acquired on a Bruker AM 300 spectrometer equipped with an Aspect 3000 computer, a variable temperature unit and a 5-mm broadband probe at 298 K. 1H-NMR data were acquired at 300.13 MHz over 8K data points with a spectral width of 3400 Hz; 32 transients were collected using a 20° pulse and a recycle delay of 3.3s. 13C-NMR data were acquired at 75.47 MHz over 32K data points with a spectral width of 22700 Hz. Approximately 20000 transients were collected (overnight) using a 30° pulse and a recycle delay of 1.5 s. COSY data were collected using the standard Bruker microprogramme COSYPHDQ.AUR; 2K data points were acquired in F2 with a 1H spectral width of 3400 Hz; 768 experiments of 16 transients were acquired in F1 with a 1H spectral width of 3400 Hz. Data were collected in phase sensitive mode and 90° phase shifted sinebell squared windows were applied in each dimension before transformation. HETCOR data were collected using the standard Bruker microprogramme XHCORRD.AUR; 2K data points were acquired in F2 with a 13C spectral width of 17200 Hz; 554 experiments of 128 transients were acquired in F1 with a 1H spectral width of 3400 Hz. Data were collected in magnitude mode. Line broadening of 3 Hz was applied to F2 and a sinebell squared window was applied to F1 before transformation. FUCOUP data were collected using the pulse sequence as specified by Halterman et al.10; 2K data points were acquired in F2 with a 13C spectral width of 17200 Hz; 768 experiments of 128 transients were acquired in F1 with a 1H spectral width of 3400 Hz. Data were collected in magnitude mode. A 90° phase shifted sinebell squared window was applied to F2 and a sinebell squared window was applied to F1 before transformation.

NMR data for 10 were acquired on a Bruker AM 400 spectrometer equipped with an Aspect 3000 computer, a variable temperature unit and a 5-mm CH probe at 298 K. 1H-NMR data were acquired at 400.13 MHz over 8K data points with a spectral width of 3800 Hz; 32 transients were collected using a 20° pulse and a recycle delay of 3.0 s. 13C-NMR data were acquired at 100.62 MHz over 16K data points with a spectral width of 20000 Hz. Approximately 30000 transients were collected (overnight) using a 20° pulse and a recycle delay of 1.0 s. COSY data were collected using the standard Bruker microprogramme COSY,AUR; 2K data points were acquired in F2 with a 1H spectral width of 3470 Hz; 512 experiments of 16 transients were acquired in F1 with a 1H spectral width of 3470 Hz. Data were collected in magnitude mode; 90° phase shifted sinebell squared windows were applied in each dimension before transformation. HETCOR data were collected using the standard Bruker microprogramme XHCORRD.AUR; 2K data points were acquired in F2 with a 13C spectral width of 20000 Hz; 512 experiments of 256 transients were acquired in F1 with a 1H spectral width of 3470 Hz. Data were collected in magnitude mode. Line broadening of 1 Hz was applied to F2 and a 90° phase shifted sinebell squared window was applied to F1 before transformation. All NMR samples were mixed with deuterochloroform (approximately 10% v/v). The deuterochloroform solvent contained an internal reference of tetramethylsilane (0.03% v/v). Infrared spectra were obtained as KBr discs on a Perkin Elmer 298 Infrared Spectrophotometer.


2.1. Synthesis

2.1.1. Preparation of methamphetamine 1 and the isolation of impurities

A solution of pseudoephedrine hydrochloride (5 g), red phosphorus (0.1 g) and hydriodic acid (10 ml) was heated under reflux for 5 h followed by the addition of water (12 ml). After standing overnight, the reaction mixture was rendered basic with 20% NaOH and the organic products extracted into ether. The ether extract was filtered and HCl gas was passed through the solution to precipitate the majority of the methamphetamine as the HCl salt. The ether was removed by evaporation to give a residual oil which was analysed by GC (Fig. 2). This oil was redissolved in ether and the basic compounds 8 and 9 and the residual methamphetamine were extracted with 10% HCl. The neutral impurities (mainly 2, 5, 6 and 10) remained in the ether solution. The individual impurities were further separated and purified by chromatography on silica.

2.1.2. Cis- and trans-1,2-dimethyl-3-phenylaziridine 4

Chloropseudoephedrine hydrochloride (2 g), triethylamine (4.5 ml) and acetonitrile (100 ml) were heated under reflux for 30 min and the resulting solution evaporated in vacuo to give the aziridine. Hexane and 5% NaHCO3 were added and the hexane layer separated. Removal of the hexane by evaporation gave a mixture of the cis and trans aziridines (64%) in a ratio 3:1 (cis/trans). The spectral data was in good agreement with the reported data3.

2.1.3. N-methyl-N-(α-methylphenethyl)amino-1-phenyl-2-propanol 11

To trans-2-methyl-3-phenyloxirane (0.5 g) and methamphetamine (1 g) in diethyl ether, boron trifluoride diethyl etherate (0.52 g) was added dropwise with stirring. After stirring for a further 20 min, the reaction mixture was heated under reflux for 20 min. A 10% HCl solution was added followed by enough 20% sodium hydroxide to render the solution basic. The organic products were extracted into ether. Removal of the ether gave the desired alcohols (0.9 g) as an approximately 1:1 mixture of diastereoisomers.

CI-MS: 11A m/z:
284 (100%, M+1), 266 (46%) 238 (39%), 192 (94%), 150 (72%), 135 (37%), 119 (69%), 91 (59%)
CI-MS: 11B m/z:
284 (83%, M+1), 266 (46%), 238 (35%),192 (100%), 150 (48%), 135 (41%), 119 (50%), 91 (37%)

2.1.4. (Z)-N-methyl-N-(α-methylphenethyl)-3-phenylpropenamide 10

Cis-cinnamic acid was prepared by the hydrogenation of 3-phenylpropiolic acid over Pd/CaCO3 in the presence of quinoline. This acid (0.8 g), methamphetamine (0.8 g) and 1,3-dicyclohexylcarbodiimide (1.6 g) in dichloromethane were stirred at room temperature for 30 min. Hexane was added and the dicyclohexylurea removed by filtration. The organic layer was washed with 5% HCl and 5% NaHCO3 to remove any unreacted staining materials and the solvent removed by evaporation. The crude product was purified by chromatography on silica.

EI-MS m/z: 279 (2%), 188 (56%) 131 (100%), 103 (30%), 91 (10%), 77 (19%), 58 (21%).

2.1.5. (E)-N-methyl-N-(α-methylphenethyl)-3-phenylpropenamide 12

Methamphetamine (1 g) was added to 10% sodium hydroxide solution in a small stoppered flash trans-cinnamoyl chloride (1 ml) was added in small portions, accompanied by vigorous shaking. The mixture was extracted with chloroform and the chloroform evaporated to give the product as an oil.

EI-MS m/z: 279 (2%), 188 (37%), 131 (100%), 103 (34%), 91 (11%), 77 (23%), 58 (20%).

3. Results and discussion

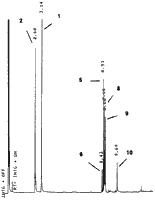
Fig. 2.
Gas chromatogram of the residual oil.

A gas chromatogram of the residual oil from the reduction of pseudoephedrine after the majority of the methamphetamine had been precipitated as the hydrochloride salt is shown in Fig. 2. Mass spectrometry confirmed the presence of a number of the previously reported products as identified by the numbers on the chart. None of the aziridines were present at the end of the reaction, but as we will show later, large amounts of these compounds were present in samples taken from the reaction mixture at early stages of the reaction. The dimer 7 was prepared by a method similar to that reported3, but none was observed in our samples.

The compounds 8 and 9 were shown to be weakly basic by extraction of the residual oil with strong acid and to contain nitrogen by analysis of this oil on a GC fitted with a nitrogen-phosphorus detector. The mass spectra indicated that these two compounds were isomeric and were the same compounds as reported in street samples in NSW (Australia) and from California5,6. Compound 10 was shown to be neutral.

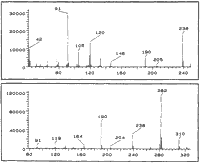
Fig. 3.
EI and CI mass spectra of 8.

The EI and CI mass spectra of compound 8 are shown in Fig. 3. The spectra for 9 were almost identical, with only very minor variations in the relative peak intensities. These two compounds are isomeric with a molecular mass of 281 from the M+1 ion in the CI spectra at m/z 282. The highest mass peak in the EI spectra occurred at m/z 238. The loss of 43 eu to give this ion was also prominent in the CI spectrum. An acetyl (CH3C=O+) fragment could account for this loss, The presence of a carbonyl group in these molecules was confirmed by the presence of a peak at 1705 cm-1 in the IR spectra.

The isomeric bases were purified by chromatography on silica. All attempts to separate 8 and 9 failed. The proton and 13C-NMR spectral data of 8 and 9 are shown in Table 1 and Table 2 and in Fig. 4 and Fig. 5, The similarity of the two structures is seen in the doubling up of the spectra in a ratio of 55:45 with slight differences in chemical shifts for 8 and 9. Detailed analysis of the NMR data (see below) enabled the structures of 8 and 9 to be established as diastereoisomers of N-methyl-N-(α-methylphenethyl)-amino-1-phenyl-2-propanone. These structures are further supported by the mass spectral data with the readily available losses of acetyl (m/z 43) and benzyl (m/z 91) fragments. Presumably the chirality of the methamphetamine fragment is fixed and the difference between the two isomers is due to variation in the stereochemistry around the chiral carbon adjacent to the carbonyl group.

Determination of the unknown isomeric species and subsequent assignment of the NMR spectra involved the interactive analysis of both 1H- and 13C-NMR data. In addition to the standard one dimensional NMR acquisitions an INEPT experiment (INsensitive Nucleus Enhancement by Polarisation Transfer experiment)7 was also acquired which rapidly determined the number of protons bound to each 13C nucleus (Table 2). More specific peak assignments were determined by the use of a variety of two dimensional NMR techniques, including Double Quantum Filtered COrrelation SpectroscopY (DQF COSY)8, HETeronuclear CORrelation (HETCOR)9 and FUll COUPling experiments (FUCOUP)10.

The initial 13C-NMR data indicated that each isomer contained carbonyl functionality, two monosubstituted aromatic rings (evident from 1H-NMR integrals), three methyl groups, two methyne groups and one methylene group. Apart from the deuterated chloroform NMR solvent, there was also a small amount of diethyl ether present (approximately 3.2% w/w) that had been used as a solvent in purification steps. DQF COSY data (Fig. 6) allowed the backbone of the isomeric species to be traced from H6 to H5 to H4a and H4b, respectively. The inequivalence of each proton bound to C4 was highlighted by the HETCOR spectrum (Fig. 7a). The HETCOR spectrum is comprised of a 13C decoupled NMR spectrum along the X-axis and a 1H-NMR spectrum along the Y-axis. Cross peaks indicate correlations between any 13C nucleus and 1H nucleus that are directly connected to each other, ie. where 1JCH coupling results.

Further analyses involved the application of a FUCOUP experiment (Fig. 7b). This two dimensional heteronuclear experiment yielded similar information to the HETCOR experiment, however, correlations for a larger variety of CH coupling became evident. This data allowed specific NMR assignments to be determined for almost all 13C and 1H nuclei (this included the specific assignment of all of the quaternary 13C nuclei without any assumptions based on chemical shift data of model compounds). The aromatic methyne peaks could not be specifically assigned chemical shifts due to a lack of spectral resolution. The resultant data was sufficient to determine the general structure of isomers 8 and 9.

Fig. 8.
Preparation of the alcohols 11.

To further confirm the structures of 8 and 9, they were reduced with sodium borohydride to a diastereomeric mixture of alcohols 11. The same mixture of alcohols, as determined by GC/MS was prepared by the reaction of methamphetamine with trans-2-methyl-3-phenyloxirane catalysed by boron trifluoride as shown in Fig. 8.

Fig. 9.
The synthesis of 10.

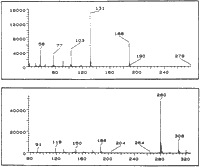
The EI and CI mass spectra of the neutral compound 10 are shown in Fig. 10. A M+1 ion was observed at m/z 280 in the CI spectrum, whilst the EI spectrum gave a base peak at m/z: 131. Purified samples of 10 were obtained after chromatographic separation of the oil on silica gel.


Fig. 10.
EI and CI mass spectra of 10.

The 1H-NMR spectrum of 10 (Fig. 11 and Table 3) indicated the presence of olefinic protons as a pair of doublets between 5.5 and 6.6 ppm (3JHH = 12.6 Hz). Perusal of the literature suggested that the m/z 131 ion in the EI mass spectrum could be due to a cinnamoyl fragment. This was consistent with the structure that was derived from two dimensional magnitude COSY11 information (Fig. 12). This structure was confirmed by the independent synthesis of 10 by coupling cis-cinnamic acid (prepared from the reduction of phenylpropiolic acid) with methamphetamine by using dicyclohexylcarboiimide as the coupling reagent (Fig. 9). This compound proved to be indistinguishable from 10 by GC/MS, 1H and 13C-NMR data (Tables 3 and 4). The 1H and 13C-NMR spectra were assigned with a combination of COSY and HETCOR experiments. The trans-cinnamoylmethamphetamine 12 was also prepared (from trans-cinnamoyl chloride and methamphetamine) and whilst the mass spectrum of this compound was very similar to that of 10 the GC retention time and proton NMR spectrum were significantly different. Compound 12 also gave two coupled pairs of doublets for the olefinic protons (3JHH = 15.5 Hz) in the NMR spectrum. The doubling of the spectral peaks in 12 was shown to be due to the presence of two rotational isomers on the NMR time-scale. The doubled peaks collapsed to give a single sharp spectrum at 100°C. Such hindered rotation in substituted amides is well documented and is observed, for example, in N-formylmethamphetamine12. Further work was carried out to establish the sequence of reactions that are occurring in the reduction. In Fig. 13 are shown chromatographs of samples of the reaction mixture analysed after 0.5 h, 2 h and 4 h reaction time. In the chromatogram taken after 30 min, the peaks due to cis and trans aziridines at 3.19 and 3.80, respectively, in an ~2:1 ratio were even more prominent than the unreacted pseudoephedrine at 5.05 and methamphetamine at 3.67 (a different GC column was used in these experiments to that used under GC/MS conditions). As the reaction proceeds, the amount of the aziridines decrease and are not seen in the final sample. After 2 h, the methamphetamine was the dominant peak with the appearance also of the peak due to phenyl-2-propanone at 3.12. After 4 h, the peaks due to the naphthalenes 5 and 6 and the isomeric bases 8 and 9 can be seen between 9.0-9.5 and the cinnamoyl derivative 10 at 10.35. The nature of the peak at 8.58 is unknown, but it also disappears with time.

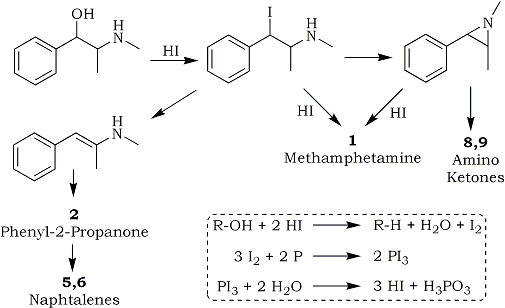
To further establish the sequence of the reactions some of these products were subjected to the reaction conditions. Phenyl-2-propanone 2 under the reaction conditions gave excellent yields of the two naphthalene derivatives in the same ratio as previously observed, suggesting that they are formed in this way in the reduction of pseudoephedrine. The observation above that the two naphthalenes are formed late in the reaction would further support this conclusion. There was a suggestion in previous work1,2 that the aziridines undergo a ring opening reaction to give 2. When the aziridines were subjected to the reaction conditions a clean reduction to methamphetamine occurred with only trace amounts of other products formed. When a 1:1 mixture of methamphetamine and the aziridines were reacted under the reduction conditions, small amounts of the bases 8 and 9 and 10 were observed, but no naphthalenes were found. A possible alternative origin of 2 is outlined in Fig. 14, but would be hard to prove as the iodo compound is only (presumably) present as a transient intermediate and the enamine would be rapidly hydrolysed to 2 under the reaction conditions. The presence of the iodo intermediate is inferred from our observation that no product resulted if hydrochloric or hydrobromic acids were substituted for hydriodic acid in the reduction of ephedrine.

Fig. 14.
A possible reaction sequence for the reduction of ephedrine by hydriodic acid.

The use of hydriodic acid as a reductant has been reported in the chemical literature over more than 100 years. Procedures have been reported using HI alone13, using molecular iodine and red phosphorus14 where the HI is formed in situ and the currently popular method for manufacturing illicit methamphetamine by using a mixture of HI and red phosphorus. The role of the phosphorus is to convert the molecular iodine formed in the reaction back to HI. Indeed, the reaction proceeds quite well in the absence of the phosphorus but in slightly lower yields.


References

  1. T.S. Cantrell, B. John, L. Johnson and A.C. Allen, A study of impurities found in methamphetamine synthesized from ephedrine. Forensic Sci. Int. 39, 39–53 (1988)
  2. H.F. Skinner, Methamphetamine synthesis via hydriodic acid/red phosphorus reduction of ephedrine. Forensic Sci. Int. 48, 123–134 (1990)
  3. T. Tanaka, T. Ohmori and T. Inoue, Analysis of impurities in illicit methamphetamine. Forensic Sci. Int. 56, 157–165 (1992)
  4. J.E. Madden, J.R. Pearson and J.E. Rowe, Differentiation of side chain isomers of methamphetamine using CC, HPLC and MS. Forensic Sci. Int. 61, 169–174 (1993)
  5. P.A. Donkin and H. Dinh. In: (4th edn..), Chemical Profile of Liquid Methylamphetamines, Technical Report, Division of Analytical Laboratories, NSW Dept. Health (May 1989).
  6. D. Christian and R. Schneider. In: Methylamphetamine via the pressure cooker, Presented at the First Technical meeting of the Clandestine Laboratory Investigating Chemists Association (September 1991).
  7. G.A. Morris and R. Freeman, Enhancement of nuclear magnetic resonance signals by polarization transfer. J. Am. Chem. Soc. 101, 760–762 (1979)
  8. M. Rance, O.W. Sorensen, G. Bodenhausen, G. Wagner, R.R. Ernst and K. Wuthrick, Improved spectral resolution in COSY 1H-NMR spectra of proteins via double quantum filtering. Biochem. Biophys. Res. Commun. 117, 479–485 (1983)
  9. A. Bax, Broadband homonuclear decoupling in heteronuclear shift correlation NMR spectroscopy. J. Mag. Reson. 53, 517–520 (1983)
  10. R.L. Haltennan, N.H. Nguyen and K.P.C. Vollhardt, First synthesis of a 1,2,3-tris(trimethylsilylated)arene by cobalt catalyzed alkyne cyclizations and application of fully coupled two dimensional chemical shift correlations to a structural problem. J. Am. Chem. Soc. 107, 1379–1387 (1985)
  11. W.P. Aue, E. Bartholdi and R.R. Ernst, Two dimensional spectroscopy. Application to nuclear magnetic resonance. J. Chem. Phys. 64, 2229–2246 (1976)
  12. B.A. Dawson, H.W. Avdovich, W.-W. Sy, G.A. Neville and L.D. Colebrook, NMR lanthanide shift reagent and molecular mechanics studies of N-formylmethamphetamine. Can. J. Spectrosc. 34, 107–112 (1989)
  13. W.E. Parham and Y.A. Sayed, Synthesis of indenes and 1,2-dialkylbenzenes. Synthesis, 116–117 (1976)
  14. C.S. Marvel, F.D. Hager and B.C. Caudle, Diphenylacetic acid, Org. Synth. Coll. Vol. 1, 224 (1943), Wiley, New York.